In this case study, we dive into the patterns of suspicious user activity to better understand and detect potential fraud risks. By analyzing key performance indicators (KPIs) such as transaction amount, session duration, and failed login attempts, we uncover trends, pinpoint regional hotspots, and identify device-specific risks to improve monitoring strategies.
These thresholds can be adjusted based on specific requirements and risk tolerance.
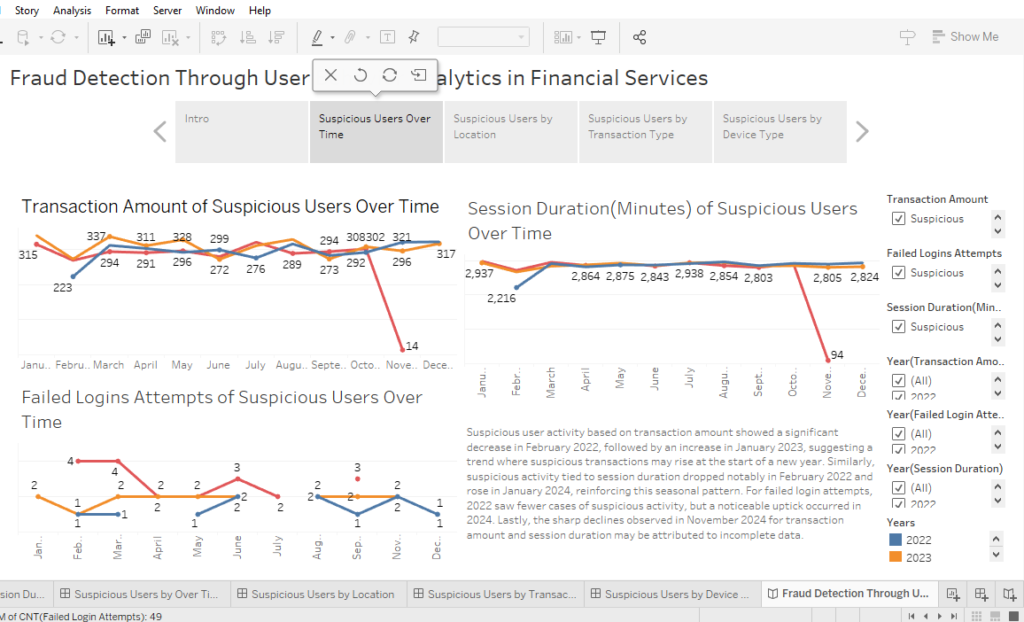
This dashboard reveals a clear seasonal pattern in suspicious transactions. February 2022 experienced a drop in suspicious activity, which then rose in January 2023. A similar rise was seen in January 2024 for session durations, showing that suspicious activity often peaks at the beginning of the year. Notably, 2024 saw an increase in failed login attempts. The sharp declines in November 2024 are likely due to partial data.
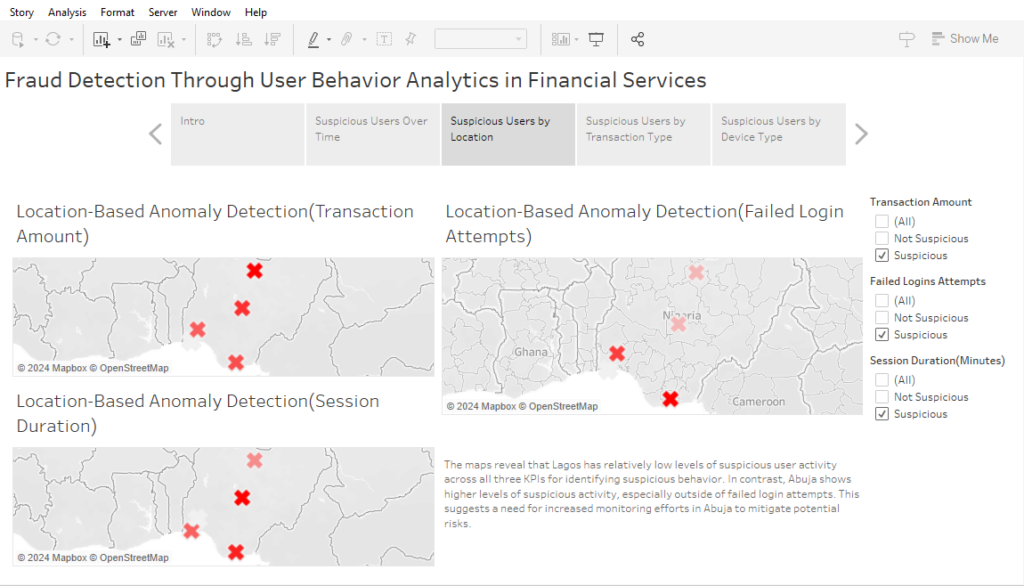
Geographic analysis maps show that Lagos experiences relatively low suspicious activity across all KPIs, while Abuja shows higher activity, particularly beyond failed login attempts. This points to a greater need for targeted fraud detection and monitoring in Abuja to reduce risks.
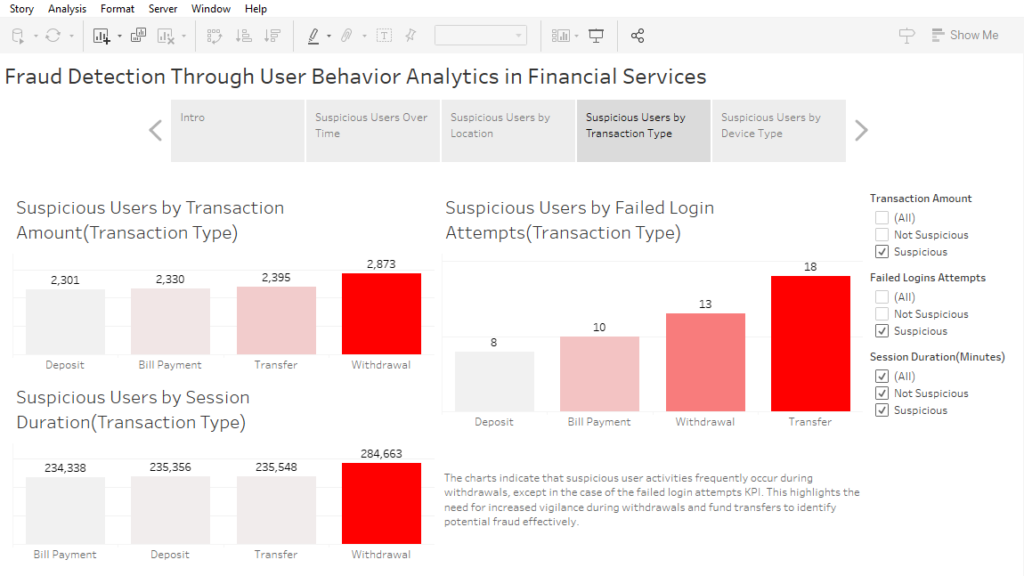
The charts illustrate that suspicious activity is often associated with withdrawals, excluding failed login attempts. This finding highlights the need for enhanced security during withdrawal and transfer processes to detect potential fraud more effectively.
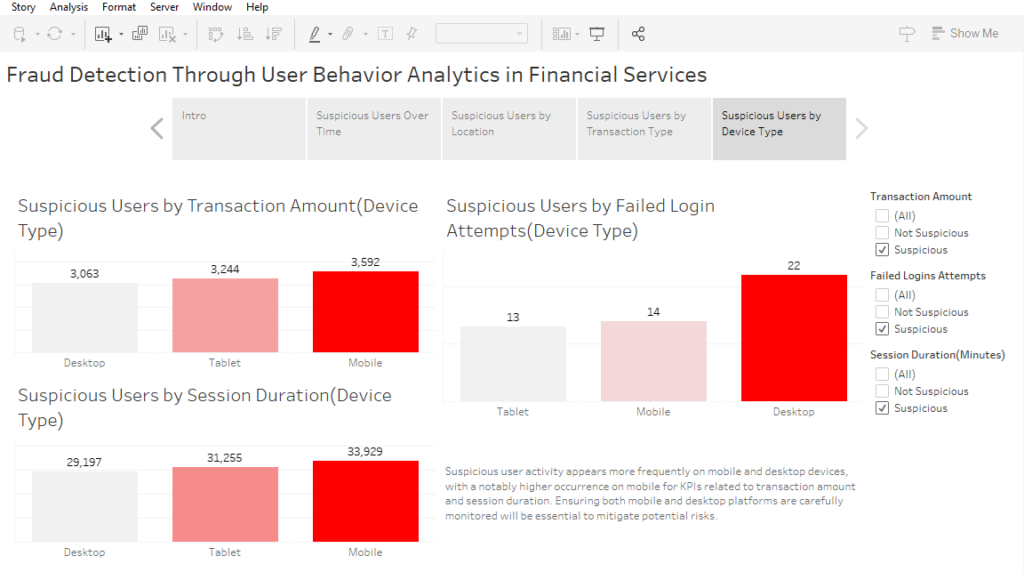
Analysis across devices shows a higher prevalence of suspicious activity on mobile and desktop, particularly for KPIs like transaction amount and session duration. Mobile devices exhibit notably higher suspicious behavior, emphasizing the need for stringent monitoring on both mobile and desktop platforms.
This case study underscores the importance of tracking seasonal patterns, regional activity differences, transaction types, and device-specific behavior to detect potential fraud risks effectively. Through targeted monitoring and threshold adjustments, organizations can better safeguard against suspicious activities and potential fraud. Future studies may explore adapting these KPIs and thresholds to specific needs, further refining fraud detection capabilities.
If you’d like to get the Tableau workbook for a more detailed look, contact us at info@kcinnovix.com