Introduction:
Effective inventory management and demand forecasting are vital for sustaining profitability and meeting customer needs in a competitive market. This case study was conducted in collaboration with a research study on select FMCG companies in Nigeria, providing valuable insights into demand patterns, inventory practices, and optimization strategies. These findings offer actionable steps for addressing inefficiencies, capitalizing on high-demand periods, and improving replenishment processes.
Summary of Results
Dashboard Analysis
Dashboard 1: Product Category Demand and Stock Level
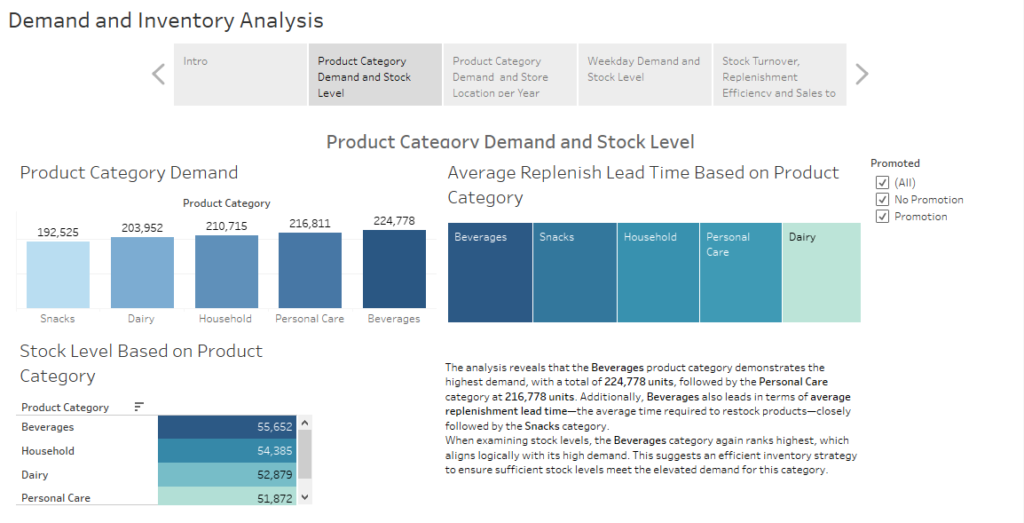
The analysis reveals that the Beverages product category demonstrates the highest demand, with a total of 224,778 units, followed by the Personal Care category at 216,778 units. Additionally, Beverages also leads in terms of average replenishment lead time—the average time required to restock products—closely followed by the Snacks category. When examining stock levels, the Beverages category again ranks highest, which aligns logically with its high demand. This suggests an efficient inventory strategy to ensure sufficient stock levels meet the elevated demand for this category.

Dashboard 2: Product Category Demand and Store Location per Year
The line chart indicates a consistent decline in demand from October to December across most years, except for 2024, as the dataset ends in September 2024. This trend suggests that demand for products tends to peak between January and September, presenting an opportunity to maximize sales during this period. Interestingly, this decline occurs regardless of promotional activities, with one notable exception in 2022, where demand increased without any promotion. Further analysis is needed to understand the factors driving this anomaly, as replicating these conditions could help counteract similar declines in 2023 and 2024. Additionally, when examining demand by store location, there was a significant shift in 2024, with demand transitioning from urban areas to suburban areas. This shift resulted in urban locations experiencing the lowest demand. Further investigation is required to identify the underlying causes of this change and adapt strategies accordingly.

Dashboard 3: Weekday Demand and Stock Level
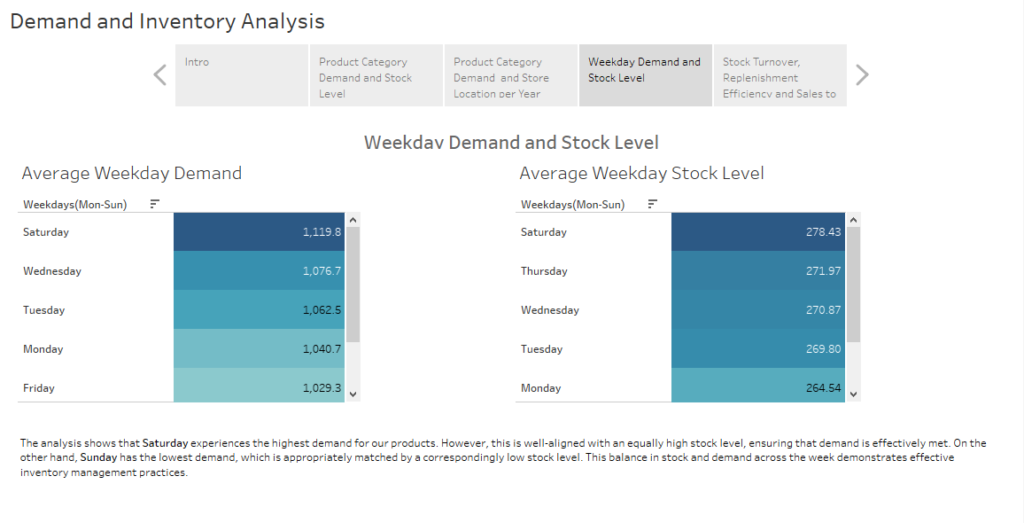
The analysis shows that Saturday experiences the highest demand for our products. However, this is well-aligned with an equally high stock level, ensuring that demand is effectively met. On the other hand, Sunday has the lowest demand, which is appropriately matched by a correspondingly low stock level. This balance in stock and demand across the week demonstrates effective inventory management practices.

Dashboard 4: Stock Turnover, Replenishment Efficiency and Sales to Price Ratio
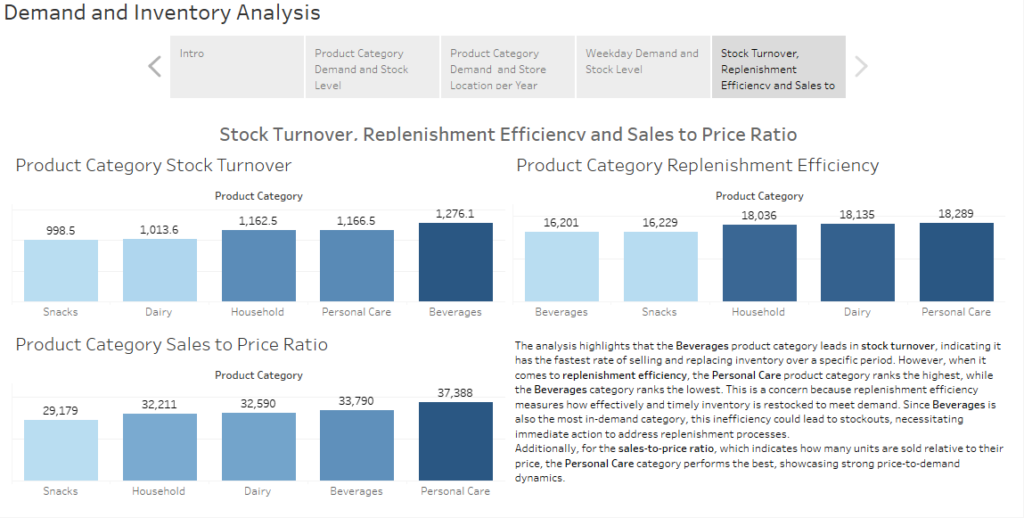
The analysis highlights that the Beverages product category leads in stock turnover, indicating it has the fastest rate of selling and replacing inventory over a specific period. However, when it comes to replenishment efficiency, the Personal Care product category ranks the highest, while the Beverages category ranks the lowest. This is a concern because replenishment efficiency measures how effectively and timely inventory is restocked to meet demand. Since Beverages is also the most in-demand category, this inefficiency could lead to stockouts, necessitating immediate action to address replenishment processes. Additionally, for the sales-to-price ratio, which indicates how many units are sold relative to their price, the Personal Care category performs the best, showcasing strong price-to-demand dynamics.

Conclusion
This analysis highlights the strengths and challenges of current demand and inventory strategies. While categories like Beverages thrive in demand and stock turnover, inefficiencies in replenishment processes could threaten availability. Seasonal trends and shifts in demand between urban and suburban areas underscore the need for adaptability and deeper market understanding. By leveraging these insights, businesses can refine inventory strategies, optimize replenishment practices, and capitalize on high-demand periods to achieve sustained growth and profitability.
If you’d like access to the